34 U.S. regional banks from Q1 2020 through Q1 2026.. Where the banks are now in 5 numbers:
-
Earnings. Net interest income after provisions has risen for six straight quarters.
-
Lending. $1.7 trillion in non-mortgage loans and $370 billion in mortgages. Over 60% of the non-mortgage book reprices within three months; over half the mortgage book is locked above 15 years.
-
Funding. $1.25 trillion in checking, savings, and money market deposits (still $60 billion below the mid-2022 peak), plus $342 billion in time deposits (up from $165 billion before 2023).
-
Investments. $55 billion in net unrealized gains on the securities portfolio at Q1 2026, recovered from a $45 billion trough in Q3 2023 when the Fed funds rate peaked at 5.33%.
-
Credit. Net charge-offs at 0.35% of loans, allowance at 1.35%. Banks have set aside roughly four years' worth of losses at today's charge-off rate.
Chart #1
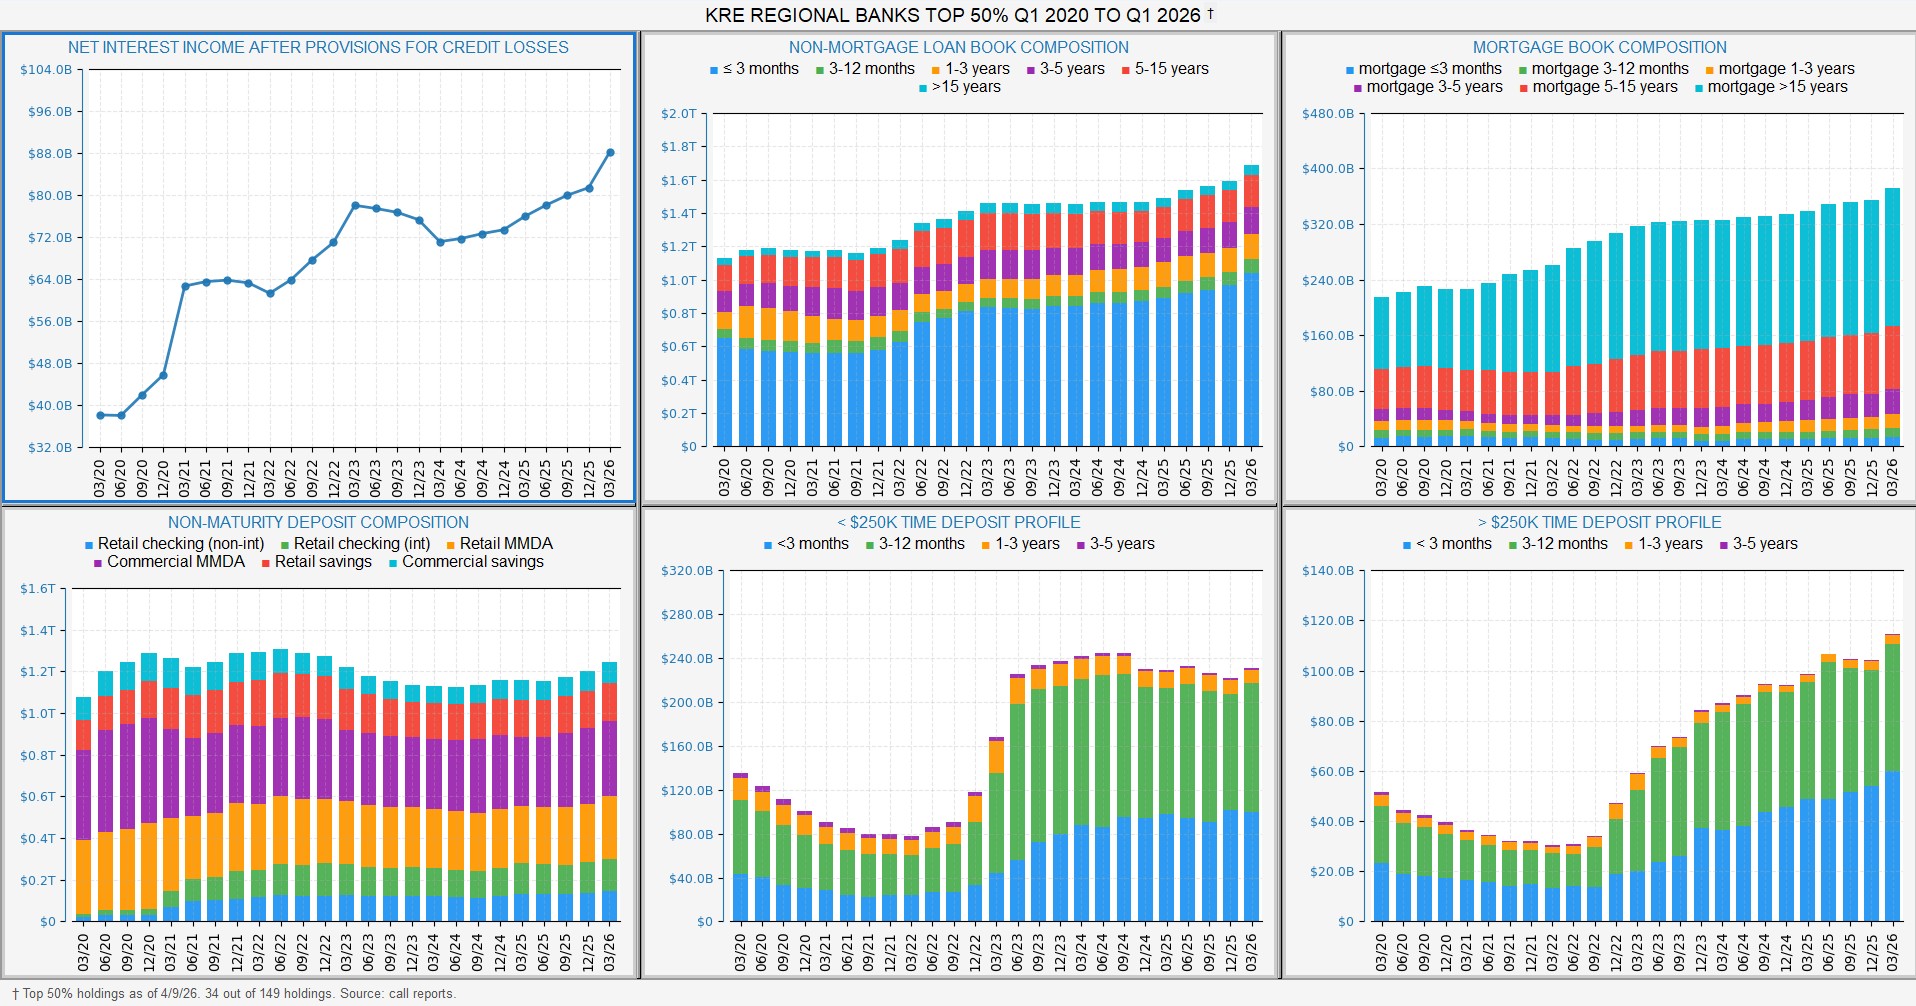
Top-left: Net Interest Income After Provisions for Credit Losses. What banks earn from lending, minus what they set aside for expected loan losses. It dropped in 2020 (COVID reserves), jumped in 2021 (releases of those reserves), held flat through 2022-2023, dipped in 2024, and Q1 2026 marks 6 quarters of increases since then.
Top-middle: Non-Mortgage Loan Book. Every loan that isn't secured by a 1-4 family residential property. Now $1.7 trillion. Each color is when the loan's interest rate next changes. The blue floor is loans that reset within 3 months, over 60% of the book.
Top-right: Mortgage Book. 1-4 family residential property loans only. Now $370 billion. The teal ceiling is mortgages whose rate is locked for more than 15 years, over half the book. The >15 year locked share peaked at about 60% in Q3 2022.
Bottom-left: Non-Maturity Deposit Composition. Money in checking, savings, and money-market accounts. Now $1.25 trillion. Peaked at $1.31 trillion in mid-2022, dropped to $1.13 trillion by late 2024, and has been climbing back. The colors split between retail customers and businesses.
Bottom-middle: Time Deposits Under $250,000. Smaller time deposits, where customers lock up money for a set period in exchange for a fixed rate. Now $228 billion. Was around $80 billion before 2023, then more than doubled in 12 months.
Bottom-right: Time Deposits Over $250,000. Larger time deposits. Now $114 billion. Followed the same pattern as the smaller CDs but grew even faster, more than tripling from 2022 to 2025.
Chart #2
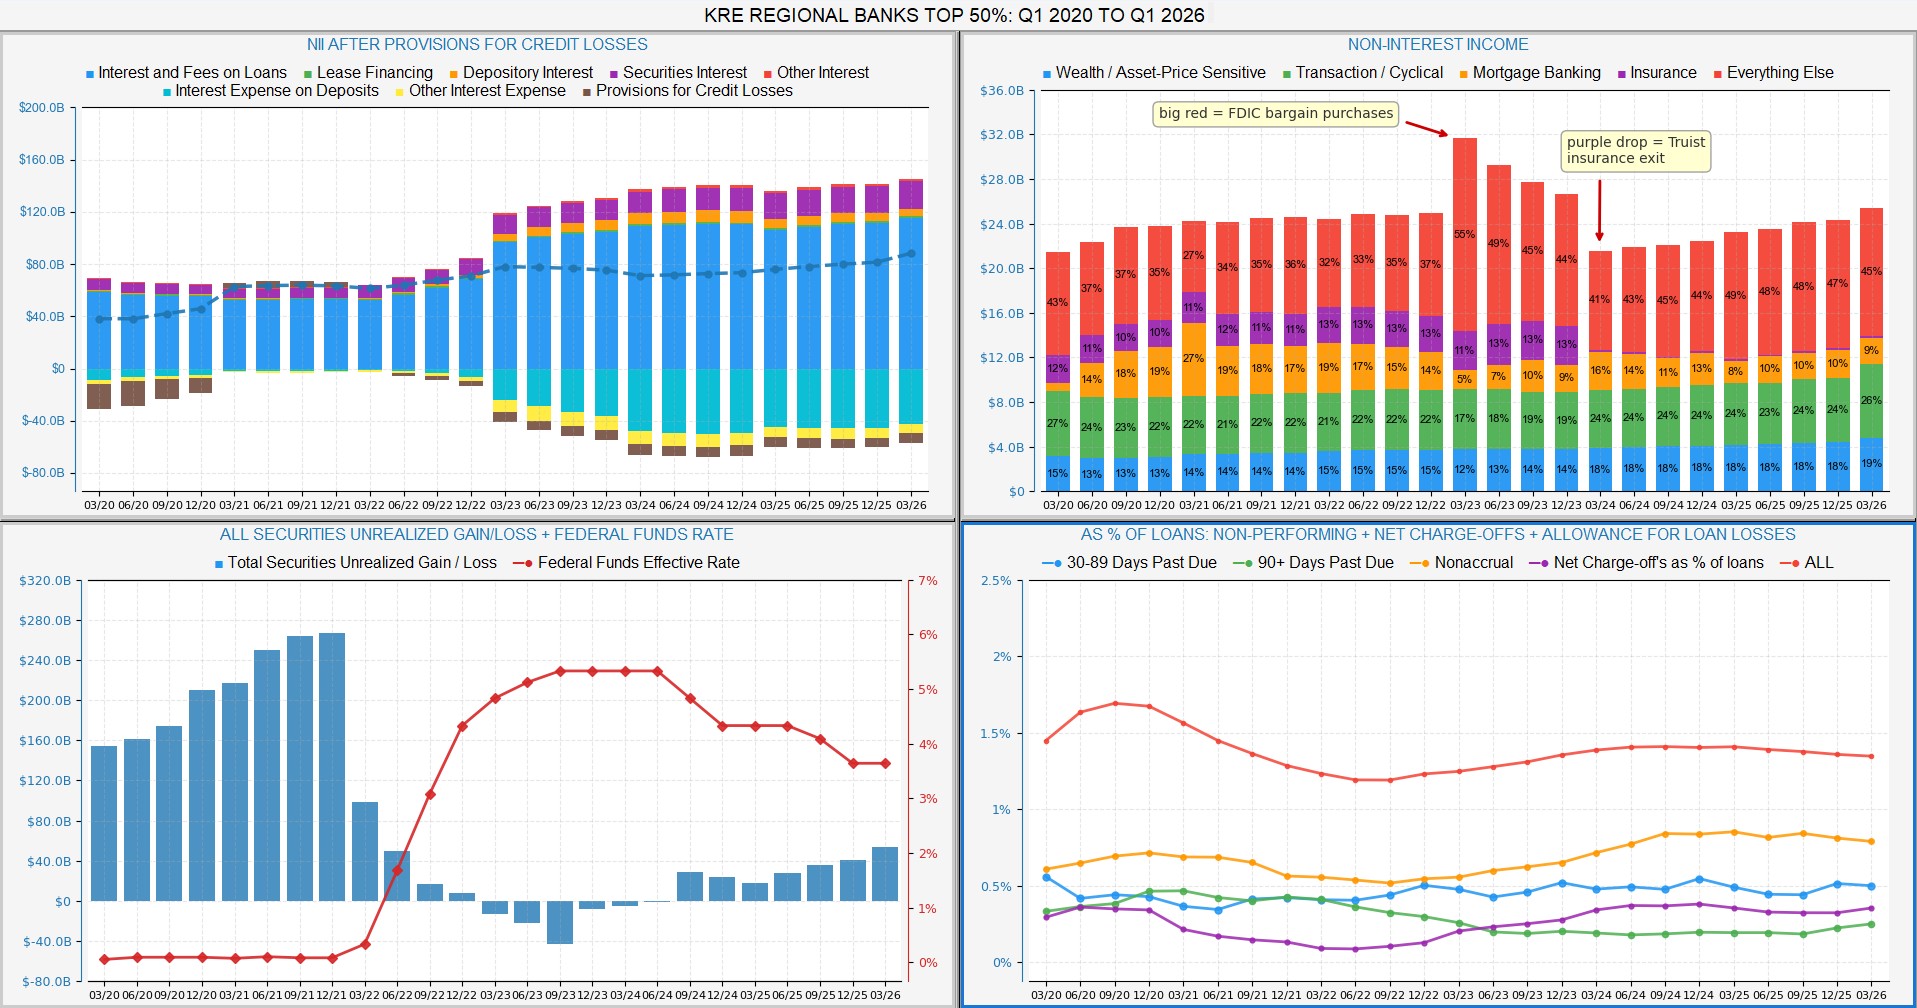
Top-left: Net Interest Income After Provisions for Credit Losses. Same metric as top-left chart #1, but broken into its underlying parts. Blue bars above zero are income from loans. Purple, orange, and other colors are smaller income sources (securities, leases, deposit fees). Cyan bars below zero are interest paid on deposits, the biggest expense. Brown bars below zero are provisions for credit losses. The dashed line on top is the net result. Both income and expense bars grew much larger starting in 2023 as interest rates rose, but the net result kept climbing because banks earn the spread between the two, not the absolute level of either.
Top-right: Non-Interest Income. Everything banks earn that isn't interest, broken into five categories: wealth management, transaction fees, mortgage banking, insurance, and everything else. The Q1 2023 spike in red is one-time accounting from regional banks acquiring failed institutions out of FDIC receivership during the March 2023 banking stress, recorded as bargain purchase gains. The purple bucket disappearing in 2024 is Truist selling its insurance brokerage business.
Bottom-left: Securities Unrealized Gain/Loss + Federal Funds Rate. Blue bars show whether the banks' securities holdings are worth more (above zero) or less (below zero) than what they paid for them. The red line is the Fed's interest rate. The relationship is mechanical: when rates rise, securities values fall, and vice versa. The Q3 2023 trough at -$45B lined up exactly with the Fed funds peak at 5.33%. Q1 2026 has gains of about $55B with Fed funds at 3.65%.
Bottom-right: Credit Quality, all as a percentage of loans. Five measures of loan health. Red on top (allowance for loan losses) is what banks have set aside expecting future losses. Orange (nonaccrual) is loans that have stopped paying. Blue (30-89 days past due) is early-stage delinquency. Green (90+ days past due) is severe delinquency. Purple (net charge-offs) is loans the bank has written off. The allowance line sits about four times higher than the charge-off line, meaning banks have set aside roughly four years' worth of losses at the rate they're currently realizing them.


