
Did 2020 or 2022 kill the 60/40?* Bond liquidity within bond funds may be normalizing sequence of returns risk for retirees.
Jerome Powell 3/30 at Harvard: "you know about fat tails? However, fat you think they are, they're fatter than that."
"The 60-40 portfolio is suffering its worst month since 2022". Scott Wapner, 3/30/26 CNBC Halftime report.
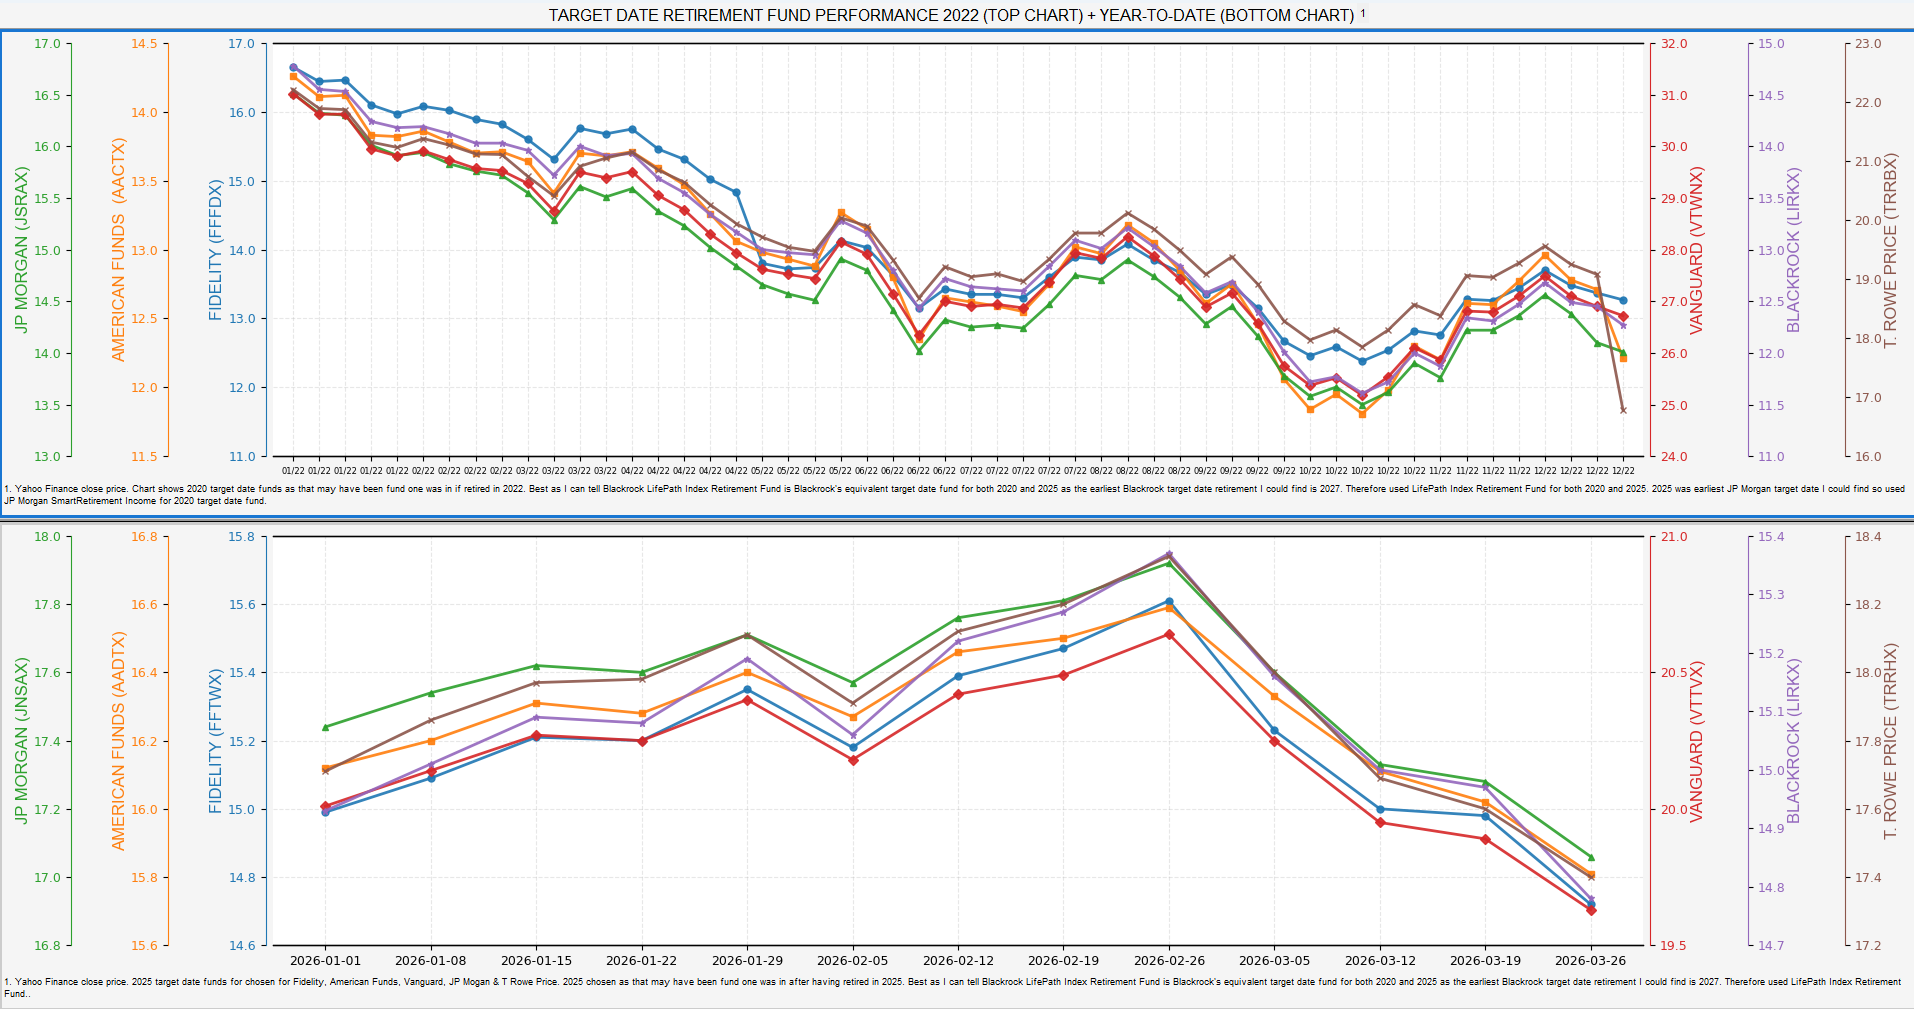
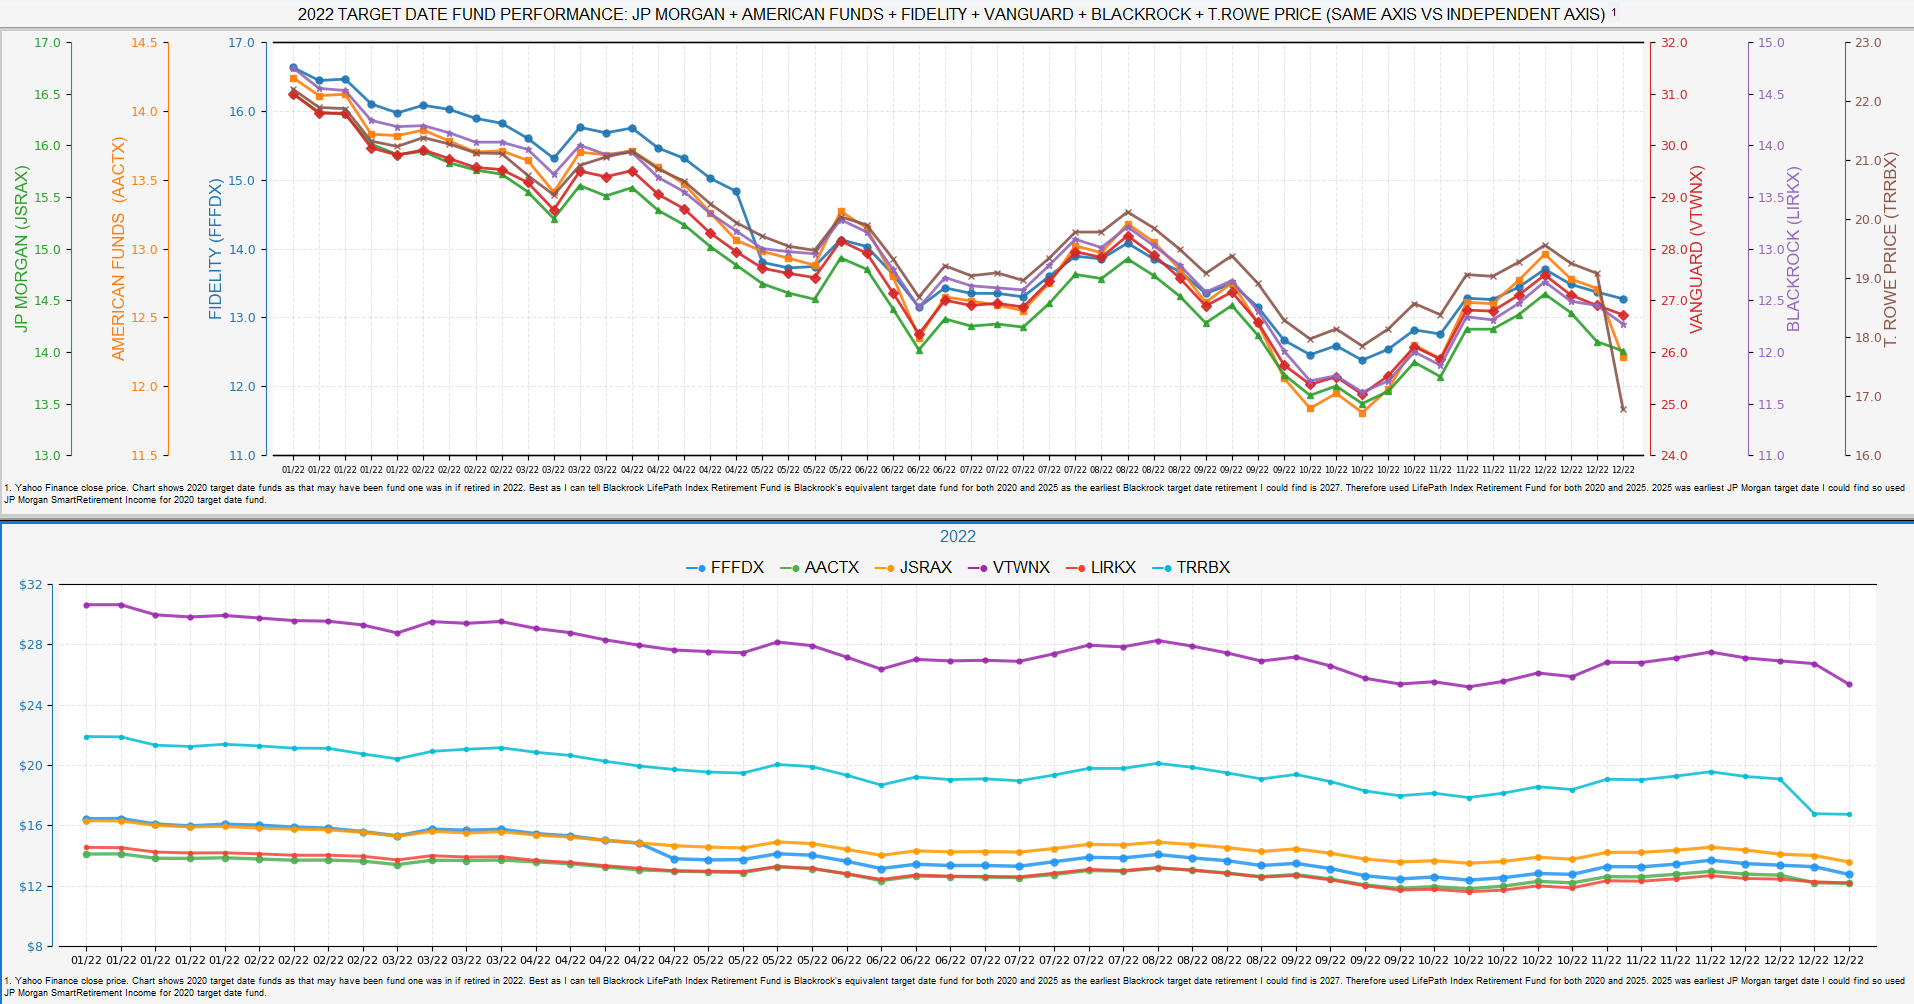
Take a look at Fidelity, JP Morgan, American Funds, Vanguard, Blackrock, T. Rowe Price target date retirement funds YTD (3/27/26) and 2022. Selling in a down market is not good if you're taking distributions. Target date funds could be your default 401(k) investment. In the same way that 60/40 portfolios hold a mix of stocks and bonds, target date funds do as well. The mix of stocks and bonds changes as you get closer to your retirement date.
To be fair these target date funds are more designed to get you to retirement, not necessarily through it. Nevertheless, I could imagine retirees signing up 30 years ago for a target date fund and being in one on the day they retire.
Perhaps individual bonds (think bond ladders) > bond funds for addressing sequence of returns risk? I just recently found out about Blackrock iBond bond ladders. I've known for a long time that separately managed account programs offer bond ladder options but not at this scale and cost.
An individual bond is attractive given that you know that value you will get at maturity. Whereas when that bond is in a diversified bond fund the overall value of the portfolio has a higher probability of fluctuating given the nature of the fund and its sensitivity to market fluctuations. The issue is that the Monte Carlo may not be capturing the true risk of taking distributions from the bond funds when compared to individual bonds.
If investors use these types of bond funds to fund distributions in retirement then these current "fat tail" "stock-and-bond move in tandem" events will slowly move from fat tail to normal.
Note that the 4% rule's survival in Bengen's model is that it depended almost entirely on bonds doing their job. When they don't, the model's floor disappears.
Including these charts to advocate for use of multi-axis in showing data in certain situations compared to individual axis. It demonstrates visual impact of seeing 2022 performance on one axis vs multiple. Edward Tufte: "The Visual Display of Quantitative Information"

